


Did Non-Voters Really Flip Republican in 2024? The Evidence Says No.
Analysis of large-scale CES data shows registered non-voters retain a strong Democratic lean.


A surprising new narrative about election strategy has taken hold within Democratic circles: what if high voter turnout is actually bad for the party? This idea hinges on the belief that the vast pool of Americans who don't vote have silently drifted into the Republican camp. If correct, this would upend conventional wisdom and carry massive implications for campaign strategy.
This claim is all over the place. It’s neat. It’s contrarian. It has been widely accepted among Democratic consultants and strategists. But is it true?
To investigate, we analyzed the Cooperative Election Study (CES), arguably the best publicly available large-scale survey data on elections. The CES provides a robust dataset, particularly valuable due to its large sample size and timing.
Here’s the bottom line up front:
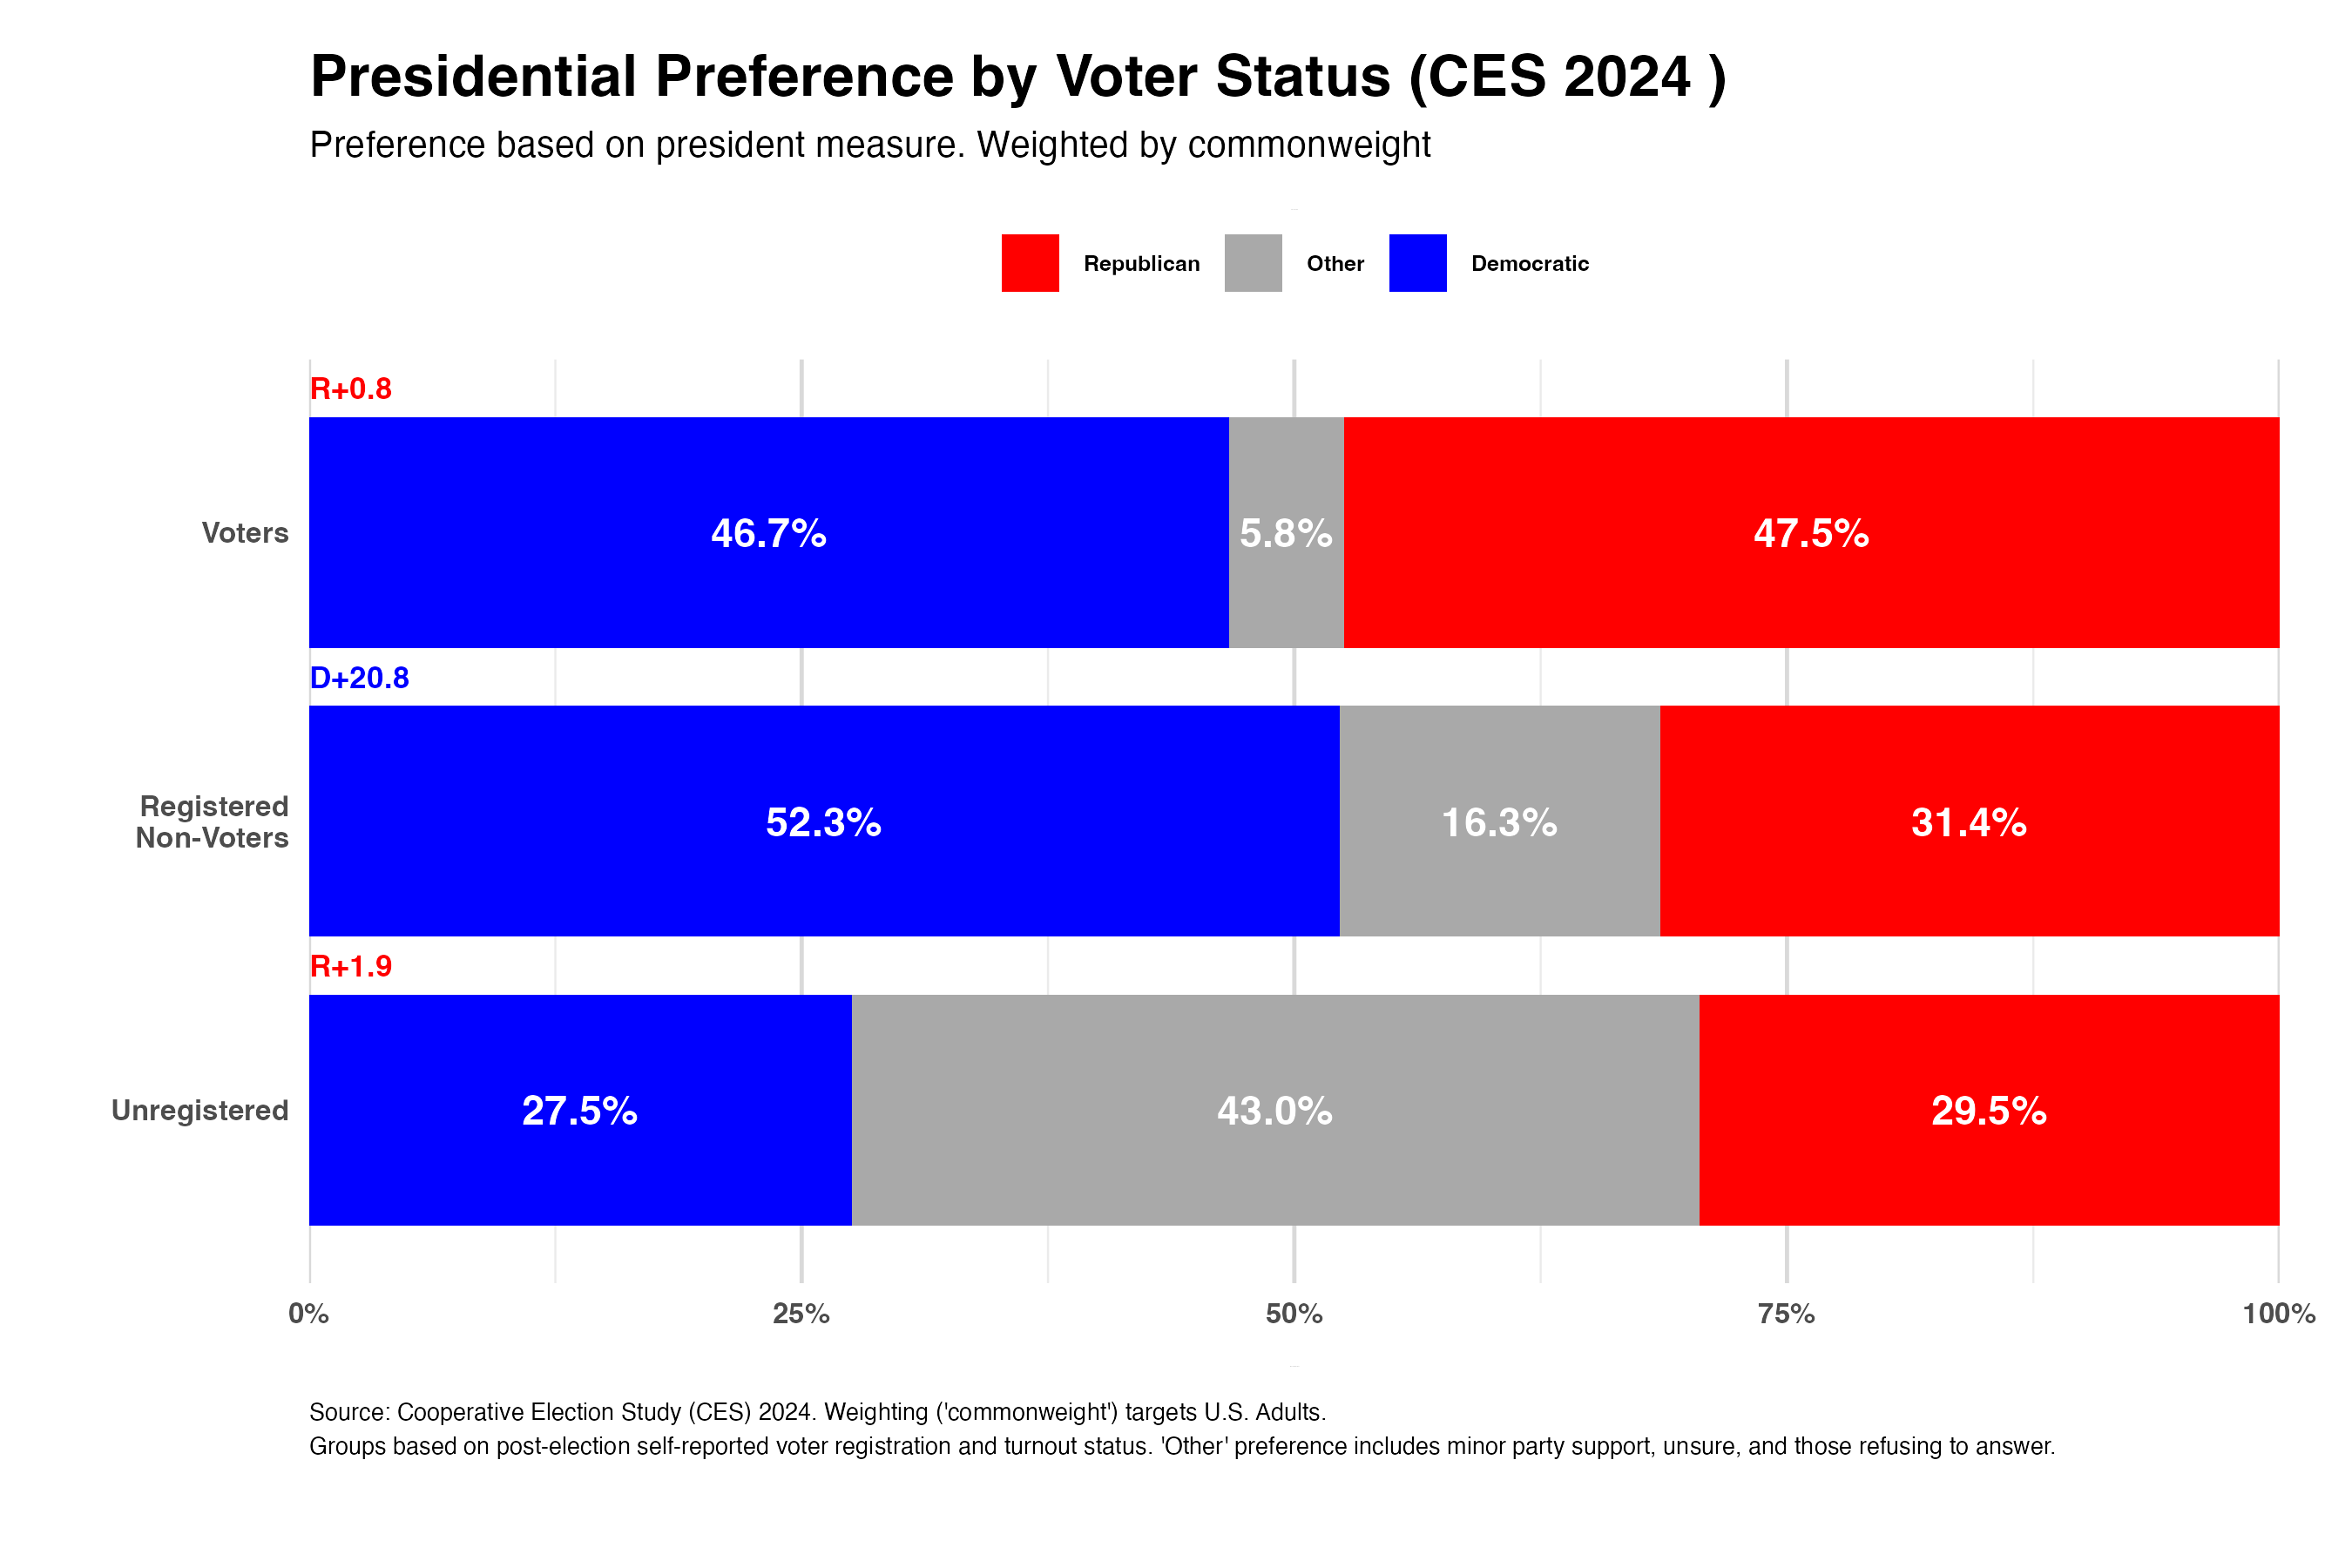
Registered non-voters leaned strongly Democratic in 2024. They favored Democrats over Republicans by 24.6 percentage points in party self-identification (53.1% Dem vs. 28.5% Rep) and preferred Harris over Trump by a wide margin (+20.8 points). This aligns with official party registration data showing registered Democrats significantly outnumbering registered Republicans among non-voters. This group shows clear Democratic preference, not Republican alignment.
Unregistered citizens showed ambivalence. While they narrowly preferred Trump (+1.9 points) over Harris among those expressing a choice, the largest share selected 'neither'. This suggests detachment from major parties rather than a clear Republican leaning.
Therefore, claims of a decisive pro-Republican shift among the overall non-voting population are not supported by the most reliable, large-scale post-election data currently available.
(This post is the second in a three-part series on non-voters in the 2024 election. We will update our estimates in a third post when the CES Final Release becomes available.)
Non-Voters Identify as Democrats
What can we learn about non-voters from the data? In our last post, we used a national voter file to look at the party registration of non-voters. Here, we turn to CES survey data to understand the partisan self-identification of voters and non-voters. The numbers come from asking voters and non-voters the question: “Generally, do you think of yourself as a Democrat, Republican, Independent, or Other?”

First, let's look at Voters, the group of Americans who claim to have voted in the general election. Aligning closely with the known outcome of the tight 2024 contest, the CES data shows this self-reported voting population was evenly split in terms of party identification: 44.6% identified as Democrats and 44.6% as Republicans. This accuracy regarding the self-reported electorate lends credibility to the survey's findings for other groups.
(Disclaimer: It's important to note that these initial 2024 figures are based on self-reported voting. We will publish a new post when the finalized voter-validated data, which matches survey responses to official turnout records, is available.)
Focusing specifically on Registered Non-Voters, the CES data shows a strong Democratic leaning in party identification for 2024. This group favored Democrats over Republicans by a significant 24.6 percentage points (53.1% identifying as Democrat vs. 28.5% as Republican). This finding aligns with patterns seen in national voter files (as discussed in our previous post). Analysis of those files shows that among registered non-voters, Democrats outnumber Republicans by a two-to-one margin in official party registration, corroborating the underlying Democratic lean found in survey self-identification.

Turning to Unregistered Citizens, the CES data indicates they also identified more frequently as Democrats than Republicans in 2024, although less overwhelmingly than registered non-voters and more likely to not lean towards either party. Like registered non-voters, this group contributes to the overall pattern seen over the past several election cycles where, among Americans who do not vote, more self-identify as Democrats than Republicans.
Non-Voters Lean Harris Over Trump, But Also Support “Neither”
Another way to gauge non-voters’ preferences is by asking them who they would have supported had they voted. One problem with asking non-voters which candidate they prefer is that a common (and honest!) response is a non-response — answering “I don’t know,” “neither,” or just refusing to answer at all. There’s a reason these people didn’t vote, after all. But this data is worth looking at, too.
First, consider the Voters surveyed in the CES. Their self-reported vote choice showed a virtual tie (Trump +1 point edge over Harris), closely mirroring the actual popular vote margin and again lending credibility to the survey's estimates.¹
Turning to the non-voting groups, the CES estimates show distinct preferences:
Registered Non-Voters strongly favored Harris: This group preferred Harris over Trump by a +20.8 percentage points. This wide margin clearly indicates a Democratic preference within this segment, directly challenging claims that registered non-voters have shifted decisively toward the Republican party.
Unregistered Citizens leaned slightly to Trump, but most chose neither candidate: Among unregistered citizens stating a preference, Trump held a +1.9 point advantage over Harris. However, 'neither' was the single most common response (43%). This pattern suggests ambivalence and detachment from the major parties, rather than a solid base of Republican support.
In sum, the CES data reveals a Democratic lean among registered non-voters and ambivalence among the unregistered, further undermining claims of a broad Republican shift within the non-voting population.
Previous Evidence of a Republican Shift Is Questionable
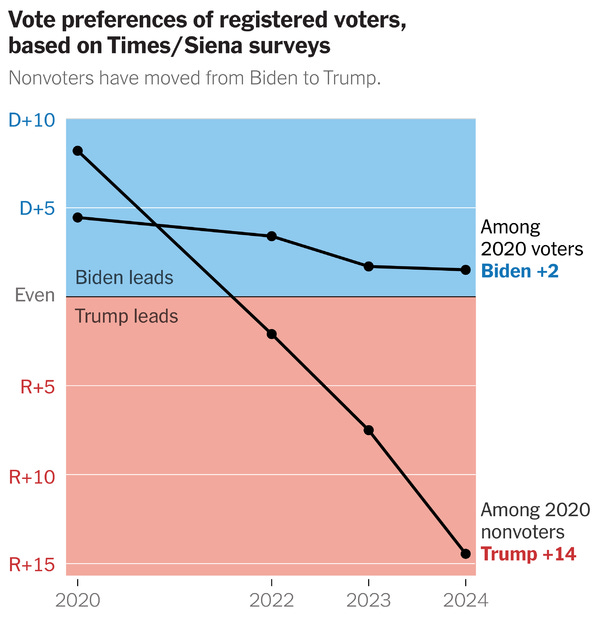
Where did the "non-voters lean Republican" narrative originate? It gained prominence after data strategist David Shor presented evidence to Ezra Klein in a widely cited New York Times interview. The key evidence? A chart from a NYT/Siena poll from May 2024—which also featured prominently in Shor's slide deck that the Times called "an important political document." What goes unmentioned is that these estimates come from a survey from before Biden dropped out of the race and Kamala Harris became the Democratic nominee.
We don't speculate about why consultants and pundits are using pre-Harris data to make claims about the general election. However, building such a consequential narrative on this specific poll presents several methodological problems:
1. Outdated Context: May 2024 is not November 2024. The poll preceded Joe Biden leaving the race and occurred amid campus protests over Gaza that likely affected respondent mood, particularly among younger, Democratic-leaning demographics. Using this snapshot to characterize the non-voter population months later and after Harris became the nominee is misleading. But David Shor, as well as prominent political consultants like Lakshya Jain and pundits like Matt Yglesias, continue today to use this chart as definitive evidence that non voters swung Republican in 2024.
2. Sampling Issues: Non-voters are notoriously difficult to survey accurately, especially before the election. It's unclear if non-voters in that May poll truly represent the millions who ultimately stayed home in November.
3. Cherry-Picked Evidence: The heavy reliance on this single, months-old public poll is puzzling. If robust private datasets clearly showed non-voters swinging Republican, why elevate this specific, arguably less reliable, May snapshot as key evidence?
4. Ignoring Non-Preference: These analysis’ focus on Trump vs. Biden split among non-voters often obscure the large shares who select ‘don't know,’ ‘none of the above,’ or a third party candidate.
A second analysis cited comes from David Shor’s firm, Blue Rose Research. It estimates Trump’s popular vote margin would have expanded significantly if all voters had participated. This figure appears to be based on private survey data lacking public documentation on the sample frame, data sources, or methodology.
Blue Rose Estimate of If Everyone Had Voted
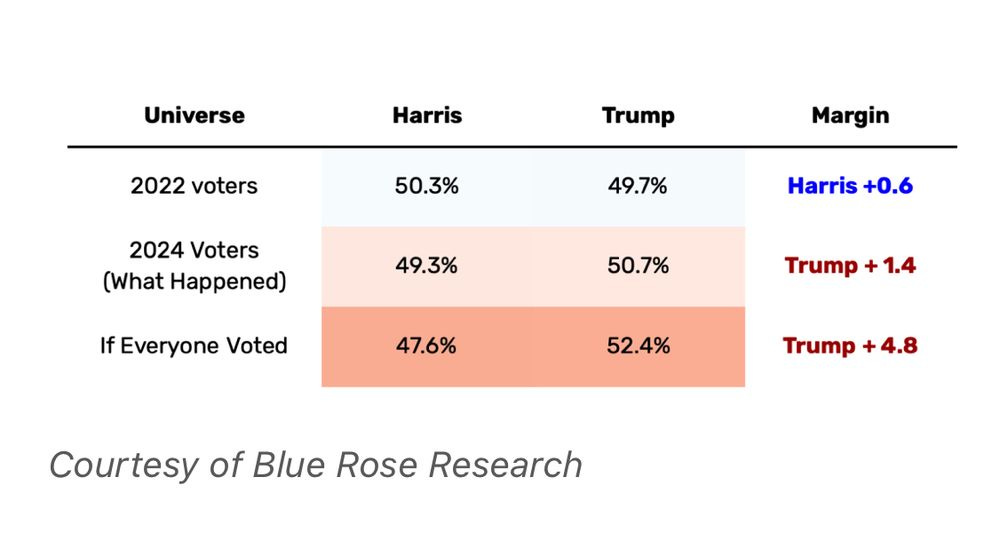
While we cannot directly analyze this private data, its implication—a strong Republican preference among non-voters—is dramatically different from public data. For Trump's margin to increase so substantially, non-voters would need to break heavily for him, requiring him to win nearly all Republicans plus a very high percentage (e.g., >70%) of registered Independents. This scenario starkly contrasts with the CES data finding non-voters identifying as Democrats (+24.6 points for registered and +4.4 for unregestered) and preferring Harris (+20.8 points for registered and -1.9 for unregistered).
Finally, strong Democratic performances in recent special elections has been interpreted as evidence that the party benefits from lower turnout environments. But the question is not whether a special election serving as a referendum against an unpopular outparty president has different turnout than a presidential election, but whether higher turnout would favor Democrats or Republicans within the same electoral context. We show evidence that in 2024, higher turnout would have helped Democrats: Democrats turned out at a lower rate than registered Republicans (83% to 90%), and non-voters leaned Harris. In recent special elections under the Trump presidency, differential partisan turnout favored Democrats—but without an analysis of non-voters in that election, we know little about what higher turnout would mean. If Harris had won the presidency and began ignoring judicial orders in order to implement a set of aggressive leftwing policies, the electorate in a low-turnout special election could more like 2010, when an angry Tea Party Republican electorate turned out in greater numbers than unenthused Democrats.
Why the CES is the Public Gold Standard for This Analysis
When analyzing challenging groups like non-voters, data quality is paramount. Unlike analyses relying on single pre-election polls or opaque private data, the Cooperative Election Study (CES) provides a uniquely robust and transparent public resource. Its massive sample size (over 60,000 respondents in 2024) allows for reliable analysis of crucial subgroups like registered non-voters and the unregistered, capturing their views close to the election (October-November).
Furthermore, the CES is rigorously designed for accuracy. It uses matched sampling and advanced weighting to ensure the sample reflects the U.S. adult population across key demographics, resulting in estimates that closely track actual election outcomes. Crucially, the CES methodology includes validating survey responses against official voter records (though 2024 validation is pending), which minimizes self-reporting errors and boosts confidence in the findings. Finally, its consistent methodology across voter and non-voter groups and its complete transparency—with public data and peer-reviewed methods—allow for independent verification and ensure scientific accountability, setting it apart from proprietary research.
Once the 2024 voter validation process is complete and those weights are released, we will be able to generate even more reliable estimates for preferences of the confirmed non-voter population, which we will present in the third post of this series.
Why Getting Non-Voters Right Matters for Strategy
Predicting the behavior of non-voters is inherently challenging; they are, by definition, less engaged and harder to survey accurately. However, despite a prominent narrative claiming non-voters have become a hidden reservoir of Republican support, a careful analysis of best available evidence tells a different story.
Our examination of the large-scale Cooperative Election Study (CES) reveals that the non-voting population in 2024 did not undergo a dramatic pro-Republican realignment. Registered non-voters, consistent with past cycles and official registration records, continued to identify strongly as Democrats (+24.6 points) and clearly preferred Harris (+20.8 points) over Trump. Unregistered citizens, while showing a slight edge for Trump (+1.9 points) among those who stated a preference, were primarily characterized by ambivalence, with 'neither' being their most common choice. Neither group provides convincing evidence of a decisive shift toward the GOP.
These findings stand in stark contrast to claims—often based on outdated pre-election polls conducted before the final nominees were set or on opaque private data—that non-voters favored Trump by double digits. Such assertions are simply not supported by robust, large-scale, publicly available survey data collected close to and shortly after the election.
Getting this right has significant implications. The narrative that non-voters lean heavily Republican is frequently used to justify strategic shifts within the Democratic party, potentially prioritizing moving to the center to persuade swing voters over mobilizing existing, sympathetic non-voters. It risks misdiagnosing the party's challenges by presenting a distorted picture of the electorate.
Ultimately, while the composition and preferences of voters and non-voters fluctuate between elections, the evidence for a fundamental non-voter realignment towards the Republican party in 2024 is weak. Pundits, consultants, activists, and academics should ground their strategies and analyses in the most reliable data available, which currently indicates that non-voters, particularly those registered, remain a Democratic-leaning segment of the population.
 | A guest post by
|
 | A guest post by
|
I'm so glad you did this.
Really glad someone did this (and more glad it lines up with what I had been thinking and expecting). Next step (after cross checking with the vote validation file) would be to see what policies (if any) drove registered non-voters to stay home. I have some assumptions, but would be interested to see how well they play out.