

Do Moderates Do Better?
Uncovering Bias in Split Ticket’s WAR Scores


The authors are political scientists. (Data and Code used to perform this analysis is available here.)
Do moderate candidates perform better in general elections? Lakshya Jain and Harrison Lavelle of the political consulting firm Split Ticket say yes, “moderation is winning.”
Their argument rests on a proprietary metric they call “Wins Above Replacement” (WAR), which has become famous in Democratic Party circles. Split Ticket’s Jain gave a presentation on the WAR metric at WelcomeFest 2025, touted as “the largest public gathering of centrist Democrats.”
The idea sounds smart and comes wrapped in the authority of data. But is the data any good?
This week, G. Elliott Morris, in his newsletter Strength in Numbers, published his own analysis of the WAR metric. It was a welcome piece of scrutiny, because we were in the middle of our own deep dive into the same question. It's always a good sign when independent researchers digging into the same problem start to arrive at the same place. And our findings are very similar to his.
The takeaway from both analyses: the claim that moderation provides a major electoral boost is built on a statistical illusion. Split Ticket’s WAR isn’t the neutral measure of candidate skill it claims to be. It’s a biased metric, constructed in a way that makes moderates look good and progressives look bad.
The Two Big Problems
The case for moderation built on Split Ticket's WAR metric has two fundamental flaws. First, Split Ticket’s WAR itself is a biased measure that is engineered to favor moderates. Second, they use this already-biased metric in flawed analyses that confuse correlation with causation.
Problem 1: A Biased Measure
Let's start with the biased metric.
In political science, we have gold-standard tools for measuring the effect of a candidate's ideology. When we use these rigorous methods, we find that the electoral benefit of being a moderate is small to nonexistent in the modern era. So, the first question is: why does Split Ticket’s model find such a large effect when others don't?
The answer lies in how they construct their WAR scores.
To understand a candidate's performance, you need a baseline. The most common and intuitive one is simple: How did the congressional candidate do compared to their party's presidential candidate in the same district?
Because Kamala Harris and Donald Trump are on the ballot in every district, this creates a common yardstick. If a Democrat runs 5 points ahead of Harris in her district, she’s a strong candidate. If she runs 5 points behind, she’s a weak one. This baseline isn't perfect, but it's a straightforward way to start comparing candidates across the country.
But that’s not what Split Ticket does. They start with a baseline like this, but then they add a special, proprietary "adjustment." They argue this adjustment is necessary to account for factors like incumbency. There's a standard, transparent way to account for incumbency: you use it as a control variable in a regression. That's Statistics 101. Instead, they’ve built it into the adjustment that gets added to the score. While not inherently wrong, this approach can lead to bad conclusions if the adjustment itself is biased. To truly isolate a candidate's skill, you need to account for other factors that shape an election. The impulse to adjust the baseline is the right one. The problem is in how you do it.
For illustration, let's take the most obvious example: incumbency. Everyone knows that incumbents have a massive built-in advantage. They have name recognition, fundraising networks, and a long record of constituent service.
Now, let's say two things are true at the same time:
Incumbents, on average, get a 3-point electoral bump just for being incumbents.
Incumbents also happen to be, on average, more moderate than challengers.
If you create a model that doesn't properly separate these two facts, you will mistakenly give credit to "moderation" for the 3-point bump that was actually caused by "incumbency." We’re using the example of incumbency for clarity; this specific example doesn’t apply to the Split Ticket model. But you can substitute incumbency for any other factor that could potentially differentiate candidates—things we can see, like being from a small state, and things we can’t see, like the underlying ‘vibes’ of a district when a candidate decides to run—and see the problem.
Think of it this way: Split Ticket's formula looks like this:
WAR = (Candidate Vote Share - Presidential Vote Share) + Adjustments
Those "adjustments" should be neutral—they should help us understand candidate quality regardless of ideology. But they're not neutral. They're thumb on the scale for moderates.
We tested this directly. In 2024, when you use the simple metric—how Democrats performed compared to Kamala Harris—moderates and progressives did essentially the same. But after Split Ticket applies their adjustments, suddenly moderates appear to outperform progressives by sizable margins.
Another example is how Split Ticket’s WAR treats long-term Democratic incumbents from small states. The model essentially says: "These candidates keep winning, so they must be incredibly talented (and differences in talent are due to moderation)." But there's another explanation: They're incumbents with established brands in states where personal relationships—especially those relationships created many years ago, before the state realigned to the GOP—matter more than party labels.
Zooming out, these modeling choices from Split Ticket are pretty arbitrary, but they have major ramifications for WAR scores.
Split Ticket’s WAR Scores Are Surprisingly Unrelated to Candidate Electoral Performance
The adjustments in Split Ticket’s WAR model make the measure surprisingly unrelated to the intuitive metric of candidate performance that we mentioned earlier: How did the congressional candidate do compared to their party's presidential candidate in the same district? Statistically, this is defined as (congressional vote share - presidential vote share) for a district. We’ll call this “Votes Compared to Presidential Candidate.” For Democrats in 2024, this translates into how well a candidate does in their district compared to Kamala Harris.
The correlation between WAR and Votes Compared to Presidential Candidate is only 0.56. That means that less than a third of Split Ticket’s WAR measure is explained by how well a candidate does compared to their copartisan presidential nominee.1 There is clearly a lot more going on in the WAR measure than how well a candidate does in their election. This gives Split Ticket a ton of leeway to stack the deck in favor of moderates in their WAR metric. Our own WAR measure, BG-WAR, is much more related to Votes Compared to Presidential Candidate. We’ll return to our own BG-WAR metric and its construction in the next section.
Building a Better Model: How BG-WAR Wins on Prediction
We built our own WAR model to create a fairer measure of candidate quality. To build our model, which we call BG-WAR, we used a machine learning method called a glmnet. It's a powerful machine learning model and a standard tool for prediction.
An important difference is how we tested our model. We used a strict out-of-sample validation process.2
Judged by the standard of predictive power, our BG-WAR model is vastly superior. Our transparent, out-of-sample model explains 92% of the variation in congressional vote shares.
By their own stated criteria their model does much worse. A transparent, rigorously tested model shows that nearly all of the variation in election results can be predicted by fundamentals, leaving little room for a supposed "moderation bonus."
So what happens when we replace the biased WAR model with a more predictive model?
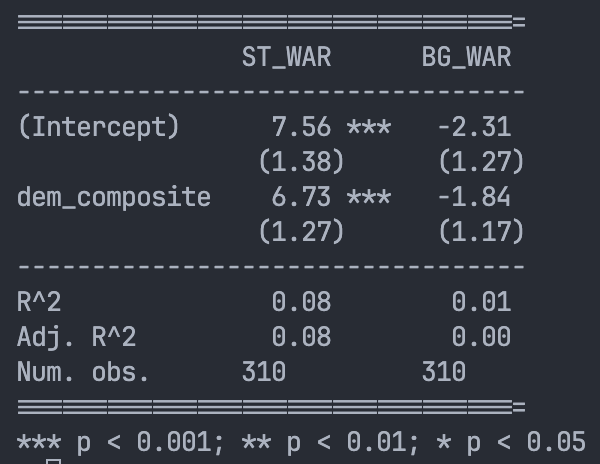
Split Ticket’s biased WAR measure suggests that moderates are expected to get about 7 percentage-points higher vote shares than progressives. That’s a lot!
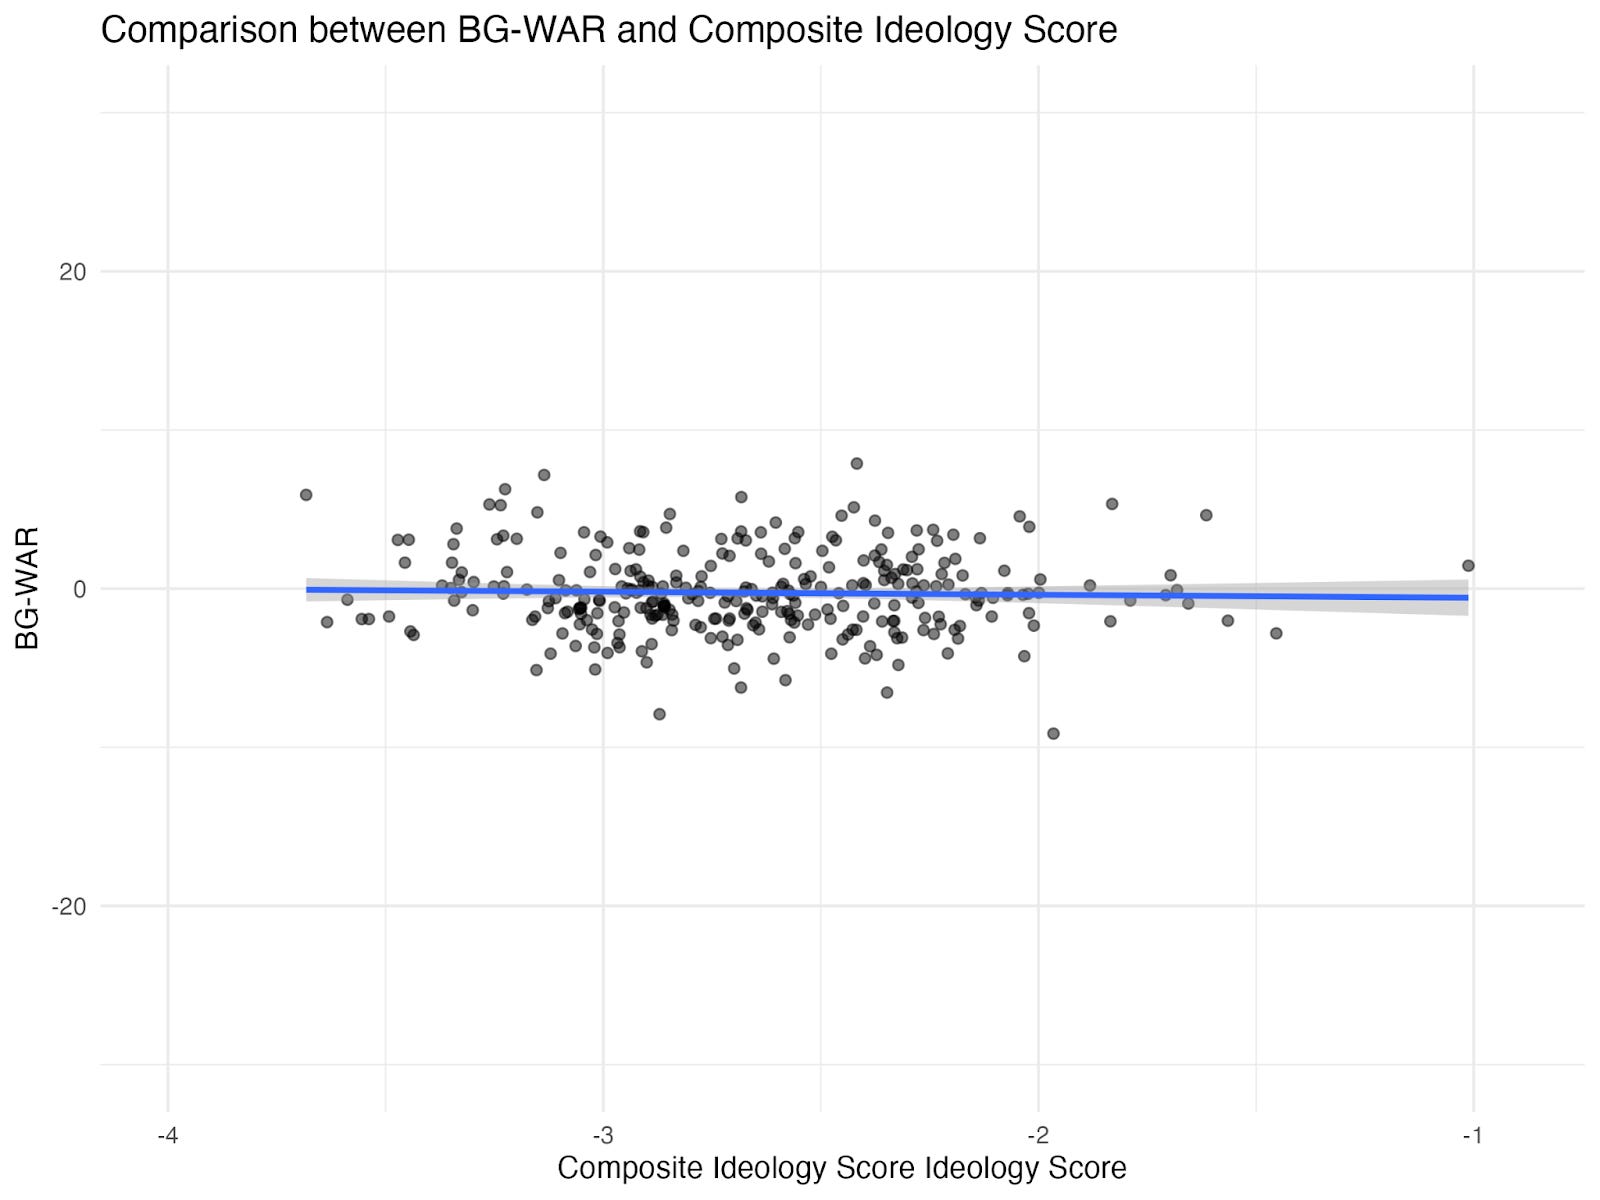
But what does the more predictive BG-WAR say? We find that moderates receive about no vote share advantage relative to progressives.3 This is more in line with G. Elliott Morris’s WAR measure, which finds that moderates outperform progressives by 1 to 1.5 percentage points. Split Ticket’s WAR is the serious outlier here—with results many times larger than ours and Morris’s. You can see the results in the figures below.4
Figure 1: The Relationship between Moderation and Split Ticket’s WAR (2024 Dems)
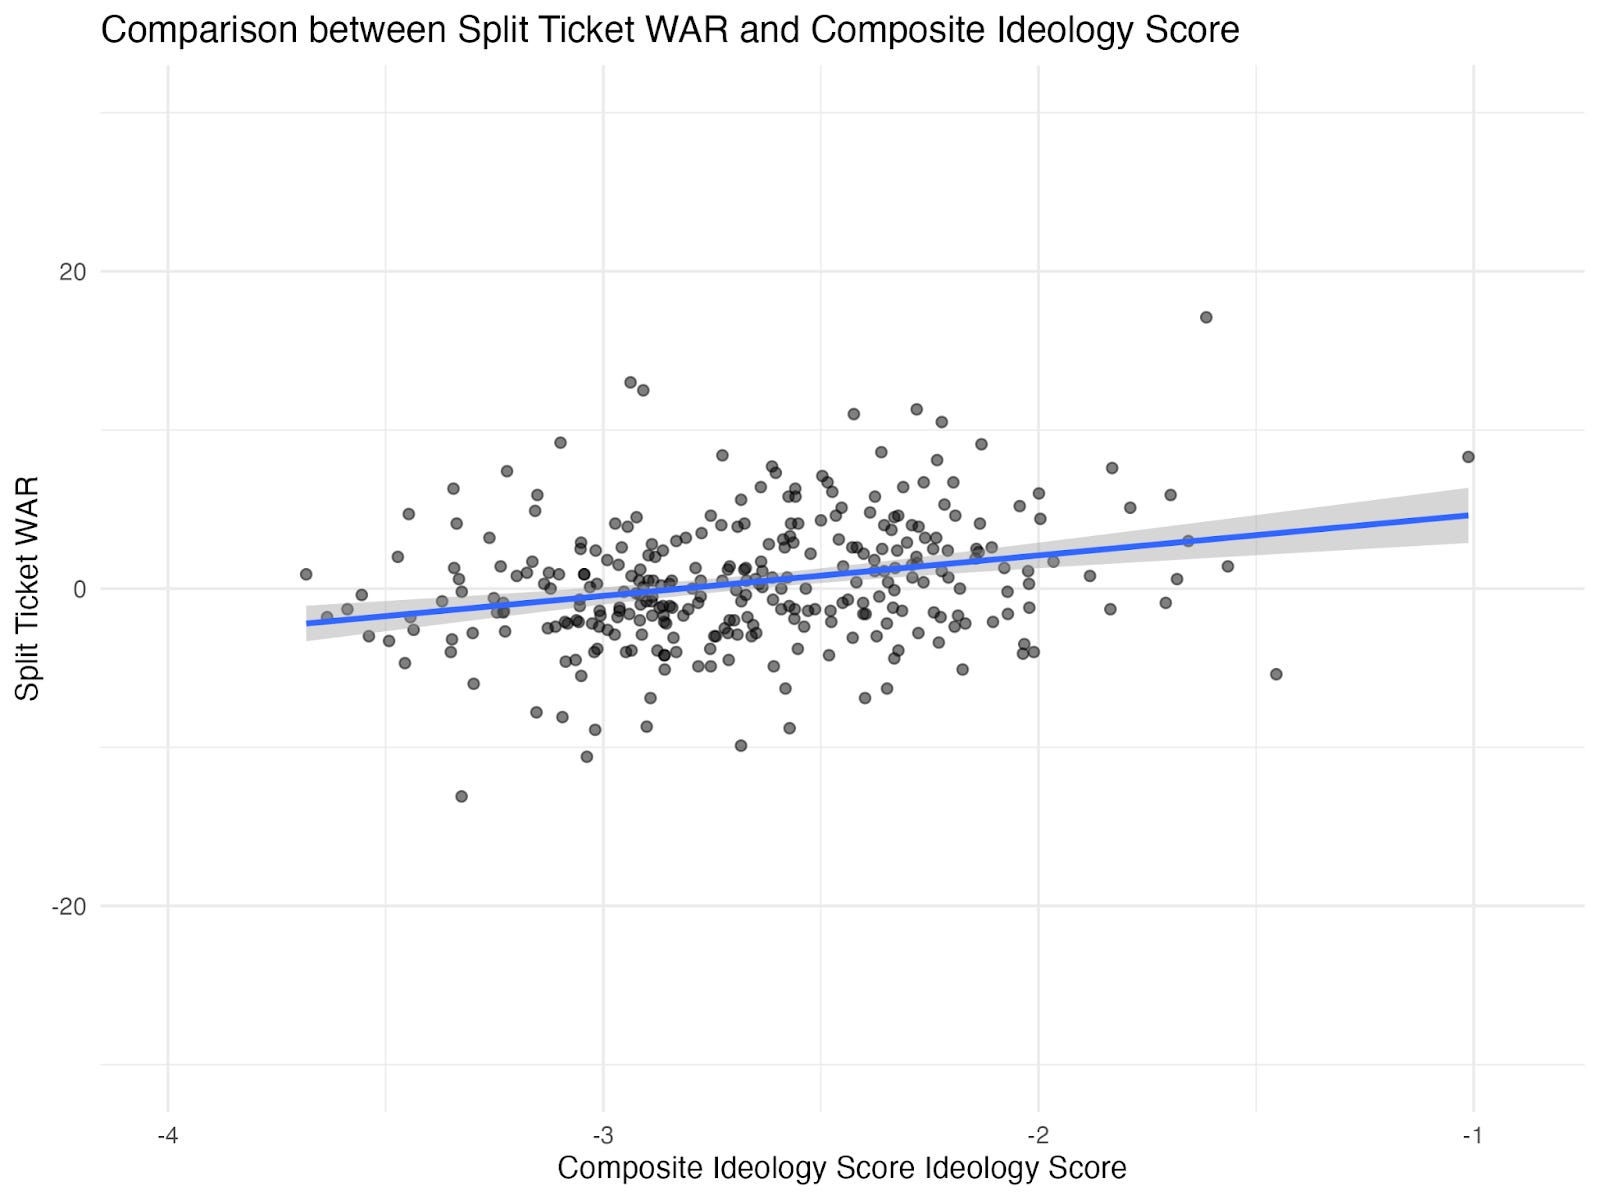
Figure 2: The Relationship between Moderation and BG-WAR (2024 Dems)
Problem 2: WAR Scores Don’t Separate Correlation from Causation
So far, we’ve addressed the first problem with Split Ticket’s WAR—that it stacks the deck in favor of moderates. But there’s an even bigger problem. Split Ticket confuses correlation as causation in its analyses of progressive and moderate candidates. Split Ticket finds that moderates have higher WAR scores than progressives, a correlation. But Split Ticket interprets this as causal evidence that running more moderates “will win more elections.”
Split Ticket’s logic is like saying all baseball players should change their names to Aaron Judge because he has the highest WAR score. It confuses correlation with causation in the most basic way possible.
In baseball, Aaron Judge’s high WAR tells teams he’s valuable. But WAR doesn’t tell you why he’s good—it doesn’t mean other players would do better by copying Judge’s batting stance. Popsicle consumption and sunburns are correlated, but popsicles do not cause sunburns. Similarly, moderate Democrats having higher average WAR scores doesn’t mean progressive candidates should become moderate.
This becomes even clearer when you consider Joe Manchin, who tops WAR rankings. Manchin deserves his high WAR score, having won as a Democrat in deep-red West Virginia. But his success came from decades of building a unique personal brand, starting when West Virginia was still a Democratic state. His moderation was credible to voters in a way that a replacement Democrat’s wouldn’t be—even a replacement with the same exact ideology. The crushing defeat of Glenn Elliott, another Democratic moderate, in 2024 demonstrates this point perfectly. Split Ticket’s WAR analyses, however, interpret Manchin’s success as driven by moderation, ignoring alternative explanations.
The Survivorship Bias Problem
Split Ticket’s analyses suffer from another source of bias. There’s a famous story from World War II about planes returning from combat with bullet holes. Military analysts initially wanted to reinforce the areas with the most holes. But they had it backwards—the planes that returned were hit in areas where they could survive. The planes that didn’t return were hit elsewhere.
Split Ticket makes the same error. In their moderation analyses, they only look at incumbents—the planes that returned to base—not those who challenged and lost despite being moderate. This is textbook survivorship bias.5
Consider how many moderate Democrats have lost in recent years while Trump-aligned Republicans won with deeply unpopular policy positions focused on tax cuts for the rich and eliminating healthcare protections. The Republican Party’s electoral success despite having one of the least popular policy agendas ever recorded suggests that traditional left-right policy and ideology aren’t driving election results.
What Political Science Shows
Academic social science disciplines like economics and political science are obsessed with separating correlation from causation. This gives us a big advantage. Two key social science approaches to separating correlation from causation are:
1. Regression discontinuity design: We look at very close primaries between moderates and progressives where the winner is essentially random, then see if moderate nominees do better in the general election.
2. Difference-in-differences: We examine whether moderate candidates outperform progressives in the same district over time, controlling for national trends.
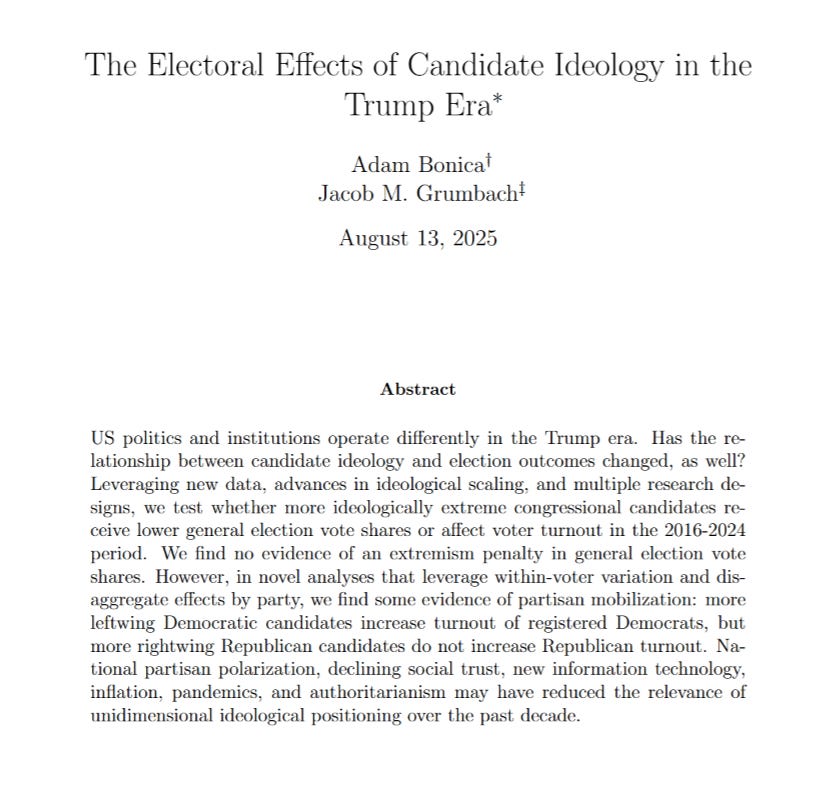
Our working paper, “The Electoral Effects of Candidate Ideology in the Trump Era,” uses these methods. The finding? No effect of ideology in either direction. When you properly separate correlation from causation, the supposed advantage of moderation vanishes.6
Another working paper from one of us (Bonica), along with coauthors Kasey Rhee and Nicolas Studen, finds small and precise effects of moderation on electoral performance. The paper, “The Electoral Consequences of Ideological Persuasion: Evidence from a Within-Precinct Analysis of U.S. Elections,” separates correlation from causation using a ‘within-precinct design’ that tests whether more moderate candidates get more votes from voters within the same precinct as more extreme leftwing or rightwing candidates.
The small to nonexistent effects of moderation in the modern era shouldn’t be surprising. Decades ago when “all politics was local,” a candidate’s moderation likely carried significant benefits. In the Trump era, by contrast, elections are driven by national tides, candidate charisma, and anti-establishment credibility—qualities that neither political consultants nor academics know how to manufacture. The difference is that we think it’s important to face that political uncertainty head on.
Why This Matters
Split Ticket’s flawed analysis isn’t just an academic concern. In a recent Washington Post op-ed, they argued that progressive Democrats are hurting the party’s chances. Split Ticket’s analyses have an aura of quantitative sophistication that make them seem credible.
But their own metric doesn’t support this conclusion. It’s built on biased measurement, uses flawed statistical methods, and ignores basic principles of causal inference. When we correct these problems using Split Ticket’s own stated criteria, the massive pro-moderation effect disappears entirely.
Technically, the correlation between Split Ticket's WAR and actual candidate performance (measured as the difference between congressional and presidential vote share in a district) is only 0.56. This means 31% of the Split Ticket WAR score is explained by overperformance relative to presidential vote shares.
In statistical terms, Split Ticket uses "in-sample" testing while we use "out-of-sample" validation.
An in-sample test is like giving a student the answer key while they take the test. They'll get a perfect score, but you’ve learned nothing about what they actually know. This is how Split Ticket’s model works. It builds its predictions using the very data it's trying to predict.
An out-of-sample test is the right way: you train the student on old exams, and then test them on a new one they’ve never seen before. Their score on the new test tells you how well they can actually perform.
Our BG-WAR model was built to predict the 2024 elections, we only trained the model on data from before 2024. To predict 2022, we only used data from other election cycles, and so on. Our model never saw the answers ahead of time.
G. Elliott Morris's WAR measure, which uses more transparent methods, finds effects of 1 to 1.5 percentage points. Our supplementary analyses using various model specifications consistently find effects under 3 percentage points, with most showing no statistically significant effect at all.
Split Ticket's WAR also has smaller biases, such as using two-party presidential vote share, which penalizes progressives like Ilhan Omar who run in districts with high third-party voting.
Our paper uses multiple identification strategies and finds null effects across all specifications. These results are consistent with other recent political science research showing that candidate ideology has minimal effects in the contemporary polarized environment. Full paper available at: https://sites.google.com/view/jakegrumbach/working-papers.
"But the value of understanding electability is not in figuring out how to win safe seats by greater margins. It lies in the clues it provides to winning swing voters who could tip the balance in battleground districts. Nominating candidates who are relatively more extreme can cost a party seats, while nominating contenders who are more moderate can gain them seats." - LJ
FWIW, I think he's relatively correct in his prescription and solution of a key problem: battleground states are difficult to win, and nominating moderates relative to progressives can help tip those scales favorable to Dems at large. Given that GEM also found an effect of 1-1.5 points, it seems that at least that is directionally correct. If the effect is overstated, that seems like a technical argument that I'm glad you three are having.
Note on the Aaron Judge metaphor - I think ST's WAR does not tell people that changing their name to Aaron Judge means that they'll do better. I think it communicates "players that bat worse than Aaron Judge could consider trying some of things that Aaron Judge does." And sure, maybe Aaron Judge is so unique and context specific that no batters should consider trying what Aaron Judge uses to be such a good player.
But at the very least, I think it's valuable to study how the Aaron Judge's habits with batting rather than trying to say "Because we don't know what can drive batting performance, there's no value in Max Kepler trying to learn from Aaron Judge."
While the quantitative argument presented here is fairly convincing on its own, I think there's a qualitative argument to make, which you may have intentionally not included so as to not muddy your argument.
It goes like this: progressive candidates often face more brutal primaries, more attacks from within, undermining by the Democratic party, itself, which then makes subpar performance of these candidates more likely in the general election. Let's take the Mamdani situation as an example. He's currently heavily favored to win, with some models suggesting a 75% probability of a win. While that feels large, especially in our era of frequent toss-up elections, note that it's not that different from what 538 predicted for Clinton in 2016, so it's hardly certain.
Now imagine if Mamdani had the backing of the party, all of the notable endorsements, and didn't have massive media machines organized against him. Do all of these things hurt his election chances? Maybe we're at the point where too many mainstream endorsements are actually harmful. But my gut still tells me that the Democratic nominee would be a shoo-in for an election in this anti-Trump political environment, and it's the "Democratic" moderates, themselves, who are preventing this.